What Is Supply Chain Visibility Software?
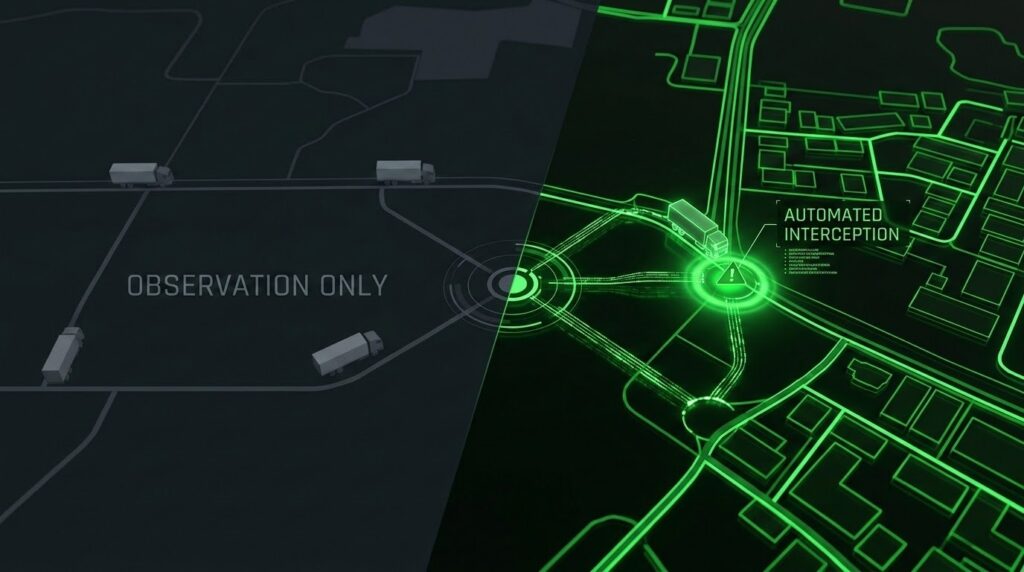
Supply chain visibility software replaces manual tracking, carrier phone calls, and spreadsheet-based status updates with a live, end-to-end view of every shipment. Most tools in this category tell you where a truck is. They do not tell you what to do about it. That gap between observation and action is where freight spend disappears. Five capabilities separate the tools that act from the tools that watch:
- Real-Time Tracking: Continuous location and status data for shipments across all modes.
- Predictive ETAs: Arrival estimates grounded in live conditions, not static carrier promises.
- Exception Management: Automated detection and escalation of delays, temperature breaches, or compliance failures.
- Centralized Data: A single operational record drawn from TMS, ERP, telematics, IoT, and EDI sources.
- Risk Management: Identification and scoring of disruption threats before they reach the customer.
If you run supply chain, logistics, or operations, this guide covers how to measure visibility and how to choose the right tool.
In IBM’s Global Chief Supply Chain Officer Study, 70% of executives ranked visibility as their single greatest supply chain challenge. That study was published in 2009. The question is no longer whether you need this software. The question is which architecture gets the right data to the right decision-maker fast enough to act.
Table of Contents
Key Features of Supply Chain Visibility Software
Every vendor claims these capabilities. The difference is whether the feature triggers a decision or just populates a screen. Five features separate the tools that act from the tools that watch.
1. Real-Time Tracking
Real-time tracking replaces the 4 a.m. phone call to a carrier dispatcher with continuous, automated location and status data. It covers ocean, air, rail, and road. If the data arrives hours late, it is not real-time. It is a history lesson.
2. Predictive ETAs
Static ETAs from carrier systems assume perfect conditions. Predictive ETAs recalculate continuously based on weather, congestion, port dwell times, and historical lane performance. The gap between a static ETA and a grounded prediction is the gap between a late delivery and a rerouted one.
3. Exception Management
A good exception engine does not wait for a human to notice a problem. It detects the anomaly, classifies its severity, and routes it to the right person with a recommended action. The goal is interception, not observation.
4. Centralized Data
Most supply chain teams pivot between five to fifteen disconnected systems to execute a single task. Operators call it the swivel-chair workaround. Centralized data pulls TMS, WMS, ERP, telematics, and carrier feeds into one operational record so the human stops being the integration layer.
5. Risk Management
Risk management scores threats before they escalate. Port strikes, severe weather, geopolitical disruptions, and supplier financial instability become actionable signals. Not surprises that arrive as a missed delivery.
Benefits of Supply Chain Visibility Software
Poor visibility does not show up as a line item. It hides inside expedite fees, demurrage invoices, customer churn, and compliance failures. These four outcomes change when the data arrives fast enough to act on.
1. Fewer Expedites and Demurrage Charges
Detect a delay 12 hours out and you reroute at standard rates. Detect it 2 hours out and you pay for a hotshot at three times the cost. Demurrage charges at ports follow the same math. A container sitting idle at $300 per day because nobody flagged the dwell time is not a logistics problem. It is a visibility problem.
2. Faster Response to Disruption
Disruption is constant. The differentiator is speed of response. A port closure, a weather event, a carrier no-show. Visibility software compresses the gap between “something went wrong” and “here is what we are doing about it” from hours to minutes. That compression is the difference between a reroute and a stockout.
3. Lower Customer-Service Load
“Where is my order?” is the most expensive question in logistics. Every inbound call costs time, headcount, and customer patience. Without automated alerts, the answer lives in email chains 47 replies deep or a WhatsApp group chat nobody audits. Accurate ETAs pushed directly to customers cut that call volume and kill the shadow communication layer.
4. Auditable Chain of Custody
Regulated shipments require proof, not promises. An immutable chain-of-custody record shows when a package was picked up, what temperature it held, who handled it, and when it arrived. This is non-negotiable in cold chain logistics, pharmaceuticals, and IVF courier operations, where a single custody gap can destroy an irreplaceable shipment.
How to Measure Supply Chain Visibility
You cannot improve what you do not measure. Most organizations claim to have visibility but cannot answer basic questions about their own performance. Here are five KPIs that separate real visibility from a dashboard that looks busy.
- On-Time-In-Full (OTIF) Rate: The percentage of orders delivered complete and on schedule. This is the ultimate output metric. If your OTIF is below 90%, your visibility tool is not translating data into action.
- Mean Time to Detect an Exception: How many minutes pass between a physical event and the moment your system flags it? A delay, a temperature breach, a missed pickup. Anything over 15 minutes in 2026 is too slow.
- Mean Time to Resolve an Exception: Detection without resolution is noise. Measure the time from alert to corrective action completed. This KPI exposes whether your team acts on alerts or just acknowledges them.
- Data Freshness: The interval between a physical event and its appearance in your system. If your data relies on batch EDI updates, it is hours old. Operators stop trusting the screen and start calling drivers at 2 AM instead.
- Chain-of-Custody Completeness Rate: The percentage of shipments with a full, unbroken custody record from origin to destination. Gaps in custody data create compliance risk and erode customer trust.
Track these five metrics monthly. Compare them against your own baseline, not against industry averages. A 10% improvement in mean time to detect is worth more than hitting an arbitrary benchmark from someone else’s survey.
How to Increase Supply Chain Visibility
Buying software alone does not increase visibility. The tool is only as useful as the data it receives and the decisions it triggers. Follow these five steps in order.
1. Connect Every Data Source, Not Just the TMS
Most implementations stall because the team connects the TMS and stops. Telematics, IoT sensors, ERP, WMS, carrier EDI, and even weather APIs all carry signals that affect decision-making. Connect them all or accept blind spots.
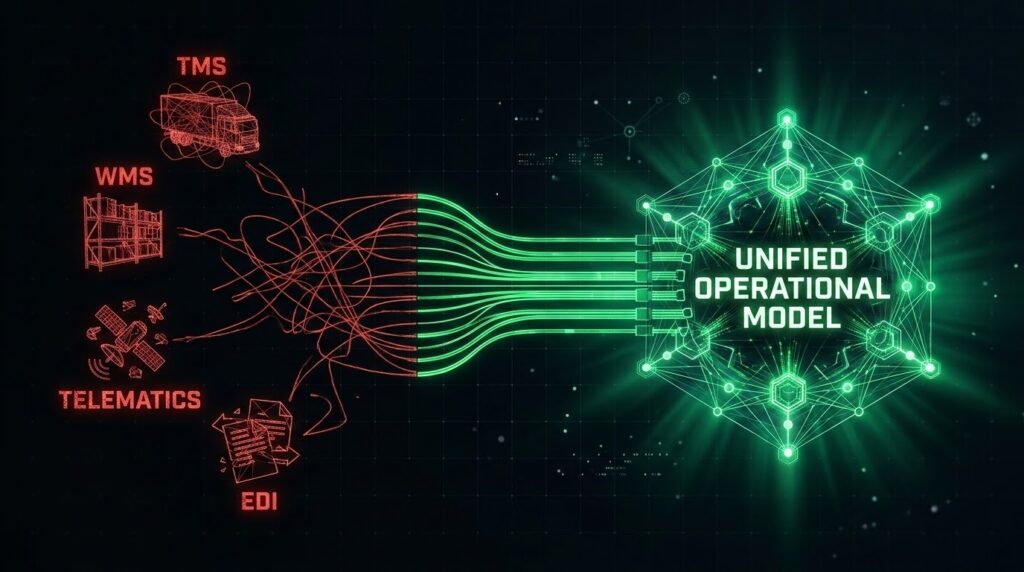
2. Unify Data Into a Single Operational Model
Connected data is not the same as unified data. Five feeds dumped into a data lake still require a human to reconcile conflicting timestamps and ID formats. That is the swivel-chair problem from Step 1 surviving under a different name. The software should normalize every source into one shared operational model automatically.
3. Move From Status Dashboards to Exception Alerts
A status dashboard is a record of what already happened. An exception alert is a chance to intervene before it does. Configure your tool to push alerts to the right person at the right severity level. If your team logs in to check a dashboard, you are already behind.
4. Give the AI Something Real to Reason From
Generic AI models trained on public data will give you generic predictions. The AI must be grounded in your routes, your carriers, your seasonality patterns, and your customer SLAs. Anything less is a guess wearing a confidence score.
5. Measure the KPIs From the Previous Section
Run the five KPIs above as a monthly operating review. If mean time to detect is not improving quarter over quarter, the tool is not working. Or the team is not using it.
How to Choose Supply Chain Visibility Software
The category is mature enough to have its own Gartner Magic Quadrant for Real-Time Transportation Visibility Platforms. That maturity means dozens of vendors who sound identical in a demo. The buying decisions hinge on six concrete questions, not on feature checklists.
Ask these during every vendor evaluation:
- Does it integrate with every data source you already run, without rip-and-replace? If the vendor requires you to migrate off your current TMS or ERP, the deployment timeline and cost will triple.
- Does it show you decisions or does it only show you a dashboard? Ask the vendor to demonstrate an exception workflow end to end. If the demo is all maps and charts with no action triggers, keep looking.
- How fresh is the data? Ask in seconds. If the answer comes back in “near real-time” or “minutes,” pin down the actual number. Vague answers mean slow data.
- Is the AI grounded in your operational data or in generic training data? A model trained on public freight data will not know your carrier’s Thursday pickup pattern at your Dallas DC.
- What is the time to live deployment? Days, weeks, or months? Ask for the median, not the best case. Ask what happens if a connector fails during setup.
- What is the data security model? Ask for specifics: encryption standard, API isolation, token scope, and inference environment. “Enterprise-grade security” is not an answer. AES-256 at rest and TLS 1.3 in transit is an answer.
- Does data flow in both directions? Most tools pull data in. Few push modifications back to 3PLs and carriers. If the platform cannot write back to your execution systems, every action still requires a phone call.
These seven questions will disqualify half the field before you reach a second demo. That is the point. Your time is the scarcest resource in the evaluation.
How Truzer.ai Approaches Supply Chain Visibility
Truzer.ai is a new entrant in this category, built on a different assumption than the incumbent tools. Most supply chain visibility software is a data lake with a dashboard on top. The data is stale by the time it reaches the screen. The AI guesses because it has no structured model of your operation.
Truzer is built as a live digital twin of the operation. Truzer calls this the ontology. Every asset, route, team, customer, and regulation is mapped to the ontology in real time. The AI is grounded in the ontology, not in generic training data. Every alert, every predicted ETA, and every recommended action ties back to an auditable, immutable record of the operation.
Deployment takes 48 hours from first connector to live control tower. Truzer connects to the existing TMS, ERP, telematics, IoT, and EDI sources you already run. No rip-and-replace. Organizations running complex compliance workflows like time-critical courier operations or Foundry-native deployment environments connect without rebuilding their stack.
Security is specific, not vague. AES-256 encryption at rest. TLS 1.3 in transit. Scoped tokens with role-based access control. Isolated AI inference environments. Zero external API calls.
Truzer is pre-launch. There are no customer logos to display and no usage stats to cite. This guide does not pretend otherwise. The thesis is simple. A live ontology that grounds every AI decision in your operational truth outperforms a dashboard built on stale data.