What Is Logistics Optimization?
Logistics optimization is the discipline of moving freight at the lowest cost per mile and the highest on-time rate the network can sustain.
Logistics optimization is not one technique. It is a connected set of operational disciplines that together determine whether the network moves freight at the cost and service the operation committed to. When operators talk about freight optimization, route optimization, load planning, or backhaul matching, they are naming individual disciplines inside the same broader practice. Run them in isolation and each one underperforms. Run them as a connected system and the network compounds gains.
The discipline covers seven operational domains:
- Route Optimization: Sequence stops to reduce deadhead and protect delivery windows.
- Load Planning: Build legal, dense loads that raise cube and weight utilization.
- Freight Matching and Consolidation: Combine compatible loads to raise loaded miles per truck.
- Warehouse and Yard Operations: Cut dwell by aligning doors, appointments, and trailer staging.
- Supplier and Carrier Coordination: Tighten tenders, ETAs, and handoffs across partners and terminals.
- Exception Management: Detect breakdowns fast, reroute assets, and preserve service commitments.
- Demand-Supply Alignment: Balance inbound freight against available drivers, trailers, and dock capacity.
VPs of Logistics, Directors of Operations, and COOs own the discipline. The work shifts from monthly review to daily operational response. Empty miles drop. On-time delivery climbs. Exception cost shrinks.
Table of Contents

Why Logistics Optimization Matters Now
Most logistics operations bleed margin in the gap between what the TMS knows and what the spreadsheet knows. Closing that gap is the discipline. It is not a dashboard project. It is an execution discipline.
The operators who do this well share a pattern. They stop treating route planning, load building, carrier scoring, and exception handling as separate workflows. They wire those decisions together so a change in one ripples correctly through the rest. This guide walks through that wiring, step by step, for the operator who needs results before the next board meeting.
Logistics Optimization vs Supply Chain Optimization
The two terms get used as synonyms. They are not.
Supply chain optimization spans sourcing, inventory positioning, manufacturing scheduling, and demand planning. It rewrites network design over 12 to 18 months. Logistics optimization sits inside that broader frame but owns a narrower, harder problem: the physical movement of goods once a commitment exists. You already promised the freight. Now you need to move it without wasting miles, hours, or trailer space.
Confusing the two leads to failed projects. A supply chain optimization initiative changes where your warehouses sit. A logistics optimization initiative intervenes on today’s dispatch board. Both matter. This guide addresses the second one.
The other distinction worth holding: logistics optimization is continuous, not periodic. A quarterly lane bid is procurement. A daily or hourly rebalancing of loads against live capacity is optimization. If your team only revisits the question at contract renewal, you are not optimizing. You are bidding.
The Seven Operations That Control Your Cost per Mile
Before touching software or AI, name the operations where margin lives or dies. Every optimization technique in this guide maps back to one of these seven.
Load Planning and Trailer Utilization
A trailer that rolls at 68% cube utilization is a trailer that forces a second truck onto the road. Load planning determines how freight fills the box: weight distribution, stop sequence, product compatibility, and axle limits. Getting this right reduces total truck-miles before a single route is planned. Dedicated load planning software automates cube and weight calculations against real shipment data, turning a two-hour manual process into a pre-dispatch check.
Route and Lane Optimization
Route optimization is not “shortest path.” It is the sequence of stops and lanes that satisfies every delivery window while minimizing deadhead between the last drop and the next pickup. For a regional carrier running multi-stop routes, a single misplaced stop can cascade 30 minutes of dwell into every subsequent delivery. The goal: maximize loaded miles per total miles driven.

Backhaul and Empty-Mile Reduction
The Bureau of Transportation Statistics has reported that roughly 20% of truck-miles in the U.S. run empty. For a 500-truck fleet, that figure translates directly into wasted fuel, wasted driver hours, and compressed margin. Empty backhaul reduction requires matching the outbound drop location to a nearby pickup within the driver’s hours-of-service window. This is a data problem: you need to know where every truck will be, when it will be free, and which loads are available in that zone.
Every empty mile burns fuel with no shipper paying for it.
Every empty mile depreciates the tractor and trailer while the odometer keeps rolling.
Every empty mile consumes the driver’s HOS and earns zero revenue.
Manual load-board hopping fails because the dispatcher cannot see capacity across the network in real time. Load boards show one side of the trip only. Triangulation across rail, road, and barge requires data the load board does not have.
A working solution requires live data on every truck’s location, hours remaining, and trailer type plus live data on every available load in the surrounding zone. It also requires a matching engine that scores both against the driver’s HOS and the customer’s window before the truck leaves. That is what eliminating empty backhauls actually requires.
Carrier and Freight Matching
For brokers, 3PLs, and shippers tendering to external carriers, freight matching determines cost and service on every load. The wrong carrier assignment shows up as a late delivery, a claims event, or a rate that eats the margin on the lane. Freight optimization software scores carriers against historical performance, rate, equipment fit, and proximity, then surfaces the best assignment rather than the first available one.
Exception Management and Recovery
No plan survives first contact with traffic, weather, or a blown tire. The question is how fast the operation detects the exception and reroutes, reassigns, or escalates. Operators who recover in minutes protect their on-time rate. Operators who discover exceptions in the post-mortem report absorb the cost.
Warehouse and Yard Operations
Dwell at the dock is silent margin loss. A driver waiting for a door, a trailer staged in the wrong spot, an appointment that drifted by 90 minutes. Every instance compresses the next leg’s window and forces overtime or detention pay. Warehouse and yard optimization aligns inbound appointments with door capacity, sequences trailer staging to match the day’s outbound plan, and exposes detention before it becomes a billing dispute. The operations that get this right turn the yard from a cost center into a buffer that absorbs upstream variance.
Demand-Supply Alignment
Every dispatch decision is a bet on tomorrow’s demand. Match too little capacity and the operation tenders loads it cannot cover. Match too much and trailers sit while drivers eat into HOS at the terminal. Demand-supply alignment looks forward across the next 24 to 72 hours, balancing inbound freight commitments against driver availability, trailer pool, and dock capacity. The output is a daily plan that holds up against actual shipper releases, not a theoretical optimum that breaks at the first rolled appointment.
KPI Framework for Measuring Logistics Optimization
You need a scoreboard before you start changing plays. The following KPIs tie directly to the seven operations above. Track them weekly at minimum.
- Cost per mile (loaded and total): Total operating cost divided by miles driven. Separate loaded miles from total miles to expose deadhead cost.
- Empty-mile percentage: Miles driven without revenue freight divided by total miles. This is the single metric that exposes backhaul failure.
- On-time delivery (OTIF): Percentage of loads delivered within the customer’s window, in full. The metric your customers score you on.
- Trailer utilization: Average cube or weight fill as a percentage of capacity. Low utilization means too many trucks on the road.
- Exception rate: Number of service failures, detention events, or missed pickups per 100 loads. High exception rates signal planning gaps or carrier quality issues.
- Planning time per load: Hours your planning team spends per load from order intake to dispatch. A proxy for automation maturity.
Every technique in the next section should move at least one of these KPIs. If it does not, it is a feature demo, not an optimization.
Step-by-Step Logistics Optimization Process
This is the sequence an operations leader follows to move from reactive dispatch to a continuously improving operation. The steps build on each other. Skipping ahead to AI without completing the data foundation is the single most common reason optimization projects fail.
Step 1: Audit Your Data Sources and Close the Gaps
List every system that touches a load: TMS, WMS, ELD, carrier portals, customer EDI, driver messaging, fuel cards, and the spreadsheet your planning team maintains because no single system holds the truth. For each system, document what data it holds, how current that data is, and where it contradicts another system.
The goal is not to pick a winner. The goal is to map every data source so you know what a unifying layer needs to connect. Most operators discover three to five critical disconnects in this audit. The TMS shows a load as delivered while the WMS still shows it inbound. The ELD says the driver is in Memphis while the carrier portal says Nashville. These disconnects are where margin disappears.
Step 2: Define Your Optimization Targets by KPI
Pick two KPIs from the framework above. Not six. Two. Assign a target and a timeline. “Reduce empty-mile percentage from 22% to 18% within 90 days” is a target. “Improve efficiency” is not.
Narrow focus forces the team to choose which operational lever to pull first. It also makes it possible to measure whether the optimization worked or just generated a new report.
Step 3: Map the Decision Points in Your Execution Workflow
Walk the lifecycle of a load from order intake through planning, dispatch, in-transit tracking, exception handling, proof of delivery, and settlement. At each stage, identify the decision that determines cost and service: Which trailer gets assigned? Which carrier gets the tender? Which driver takes the backhaul? Who gets alerted when the ETA slips?
Write these decisions down. Most operations have 8 to 12 load-level decisions that account for 80% of their cost variability. These are your optimization targets.
Step 4: Connect Your Systems to a Common Operational Model
This is the step most vendors skip. They pitch an algorithm. The algorithm needs clean, live, integrated data from every system the operation runs. Without that foundation, the algorithm trains on stale snapshots and produces recommendations the dispatcher ignores because they do not match reality on the ground.
The integration does not require replacing your TMS or WMS. It requires a layer that reads from each system, maps the data into a common structure (loads, assets, lanes, drivers, constraints), and keeps that structure current. Adding AI to your existing TMS starts here: a read-only connection that leaves the source systems untouched while building the unified model the optimization needs.
Security matters at this step. Read-only access by default. Encryption in transit and at rest. Role-based access so the carrier portal data stays isolated from customer rate data. Any vendor that hand-waves past these requirements is not ready for your operation.
Step 5: Automate the Highest-Value Decisions First
Start with the decision that has the clearest data inputs, the highest frequency, and the lowest risk of a bad outcome. For most truckload and drayage operators, that decision is backhaul assignment: matching an empty asset to a nearby load within the driver’s remaining hours.
Automation here does not mean removing the dispatcher. It means surfacing the top three backhaul options, ranked by margin and feasibility, so the dispatcher acts on a recommendation instead of scanning a load board. The dispatcher retains override authority. The system handles the search.
Expand from there: carrier scoring on spot tenders, exception escalation when an ETA breaches a threshold, pre-departure compliance checks. Each automated decision should be policy-bounded, meaning it operates within rules the operations leader sets. Not autonomous. Bounded.
Step 6: Measure, Iterate, and Expand
Compare your two target KPIs against baseline every 30 days. If empty-mile percentage dropped, investigate which backhaul corridors improved and why. If it did not, investigate whether the data inputs were stale, the policy rules were too restrictive, or the dispatchers bypassed the recommendations.
Optimization is iterative. The first pass will surface data quality issues you did not catch in the audit. The second pass will reveal policy rules that need tuning. By the third cycle, the operation starts compounding gains because each fix improves the data the next decision runs on.
Software Evaluation: What to Look for and What to Skip
The market is crowded. Legacy TMS providers bolt on “AI” features. Point solutions address one workflow. Category-native tools attempt to unify the stack. Here is a framework for evaluating any of them.
Integration Depth over Feature Count
Ask the vendor how the tool connects to your existing TMS, WMS, ELD, and carrier portals. If the answer involves a six-month implementation, a dedicated IT team, and a data migration, that tool is a replacement project disguised as an optimization tool. The right tool connects to what you already run.
Decisions, Not Dashboards
A dashboard that shows you have 200 empty trucks in the Southeast is a report. A tool that assigns the three best backhaul options to each of those trucks, scored by margin and feasibility, is an optimization. Ask the vendor: “What operational decision does your tool make or recommend?” If the answer is “visibility,” keep walking.
Auditability and Data Provenance
Every recommendation the tool produces should trace back to the data that generated it. Which load? Which driver’s HOS? Which rate? Which constraint? If the tool produces a recommendation you cannot audit, you cannot defend it to your customer, your driver, or your CFO.
A 2026 World Economic Forum report profiling industrial operations found that early adopters of ontology-driven orchestration achieved double-digit reductions in systemic waste, including fewer empty backhauls and lower cost per mile. The pattern: operators who unified their data before applying AI outperformed those who layered algorithms on fragmented systems.
Truzer: A New-Category Entrant Built on a Live Operational Ontology
Every step in this guide assumes a precondition: live, clean, integrated operating data mapped to a common structure. Most optimization projects fail because that precondition never gets met. The TMS holds loads. The ELD holds locations. The WMS holds inventory. The spreadsheet holds the truth. No single system reconciles them.
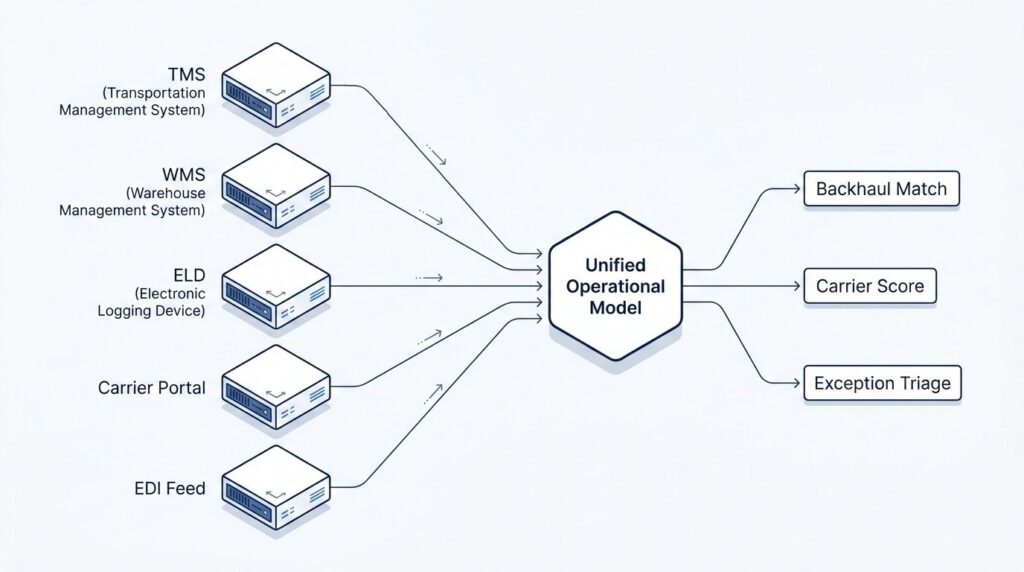
Truzer exists to satisfy that precondition. Truzer is an AI integrator for operations-heavy businesses. It connects to the systems the operator already runs (TMS, WMS, ELD, carrier portals, customer EDI) and maps every load, asset, lane, driver, and constraint into a live operational ontology. That ontology is the digital twin of the entire operation. Not a static copy. Not a data warehouse. A live, unified semantic model that updates as the source systems update.
Deployed in 48 Hours, Not 18 Months
The connection is read-only by default. Bi-directional writes activate only on the use cases the operator authorizes. No data migration. No system replacement. No new security review beyond the standard read-only credential provisioning your IT team already knows how to do. Encryption in transit and at rest. Role-based access. Immutable audit logs on every action the system takes.
Operational Decisions Grounded in the Ontology
Truzer does not produce dashboards. It produces operational decisions: which backhaul to assign, which exception to escalate, which carrier to score down. Every decision is grounded in the ontology, auditable, and immutable. Agents execute narrow, policy-bounded tasks against the live operational model. The operator sets the policies. The agents execute within them.
Four use cases ride on the same ontology today: backhaul matching, pre-departure compliance, real-time visibility, and bi-directional driver SMS. Truzer is pre-launch. The ontology is built. The integrations are live. The use cases are in validation. That is the honest status.
Your Next Move as an Operator
Logistics optimization is not a software purchase. It is a discipline that starts with understanding your data, naming your decisions, and connecting your systems into a structure that makes automated recommendations possible and auditable. The six steps in this guide work regardless of which tool you choose.
If the precondition keeps tripping you up (live, unified data across every system your operation touches), Truzer was built for that problem. One ontology. One control tower. Deployed in 48 hours on the systems you already run.