What Is Cash Flow Forecasting?
Your cash flow forecast is wrong. Not because the formula is broken, but because the data feeding it is 15 days stale and nobody in the room trusts the number enough to act on it. Cash flow forecasting is the process of estimating the timing and amount of future cash inflows and outflows to manage liquidity and fund business decisions. Done well, it is the single instrument that separates a proactive finance team from one that discovers a shortfall after the wire fails.
In 2026, the forecast is no longer a monthly artifact finance hands to the board. It is a live instrument that updates the moment a transaction clears, and every stakeholder reads off the same clock.
Two core methods define the discipline. The direct method forecasts cash flow from actual expected receipts and payments. The indirect method forecasts cash flow by adjusting net income for non-cash items and working-capital changes. The forecast serves working capital decisions, investment timing, debt service, and downstream runway calculations. Horizon matters: short-term (13 weeks) for liquidity, medium-term (12 months) for planning, long-term (3+ years) for capital structure and fundraising.
The CFO or FP&A lead owns the forecast. The board, PE sponsor, CEO, and lenders consume it. The decisions it drives span capital allocation, covenant compliance, fundraising timing, and headcount planning. When the forecast is honest, every stakeholder acts from the same number. When the forecast drifts, every downstream decision inherits the error.
Table of Contents
Why Cash Flow Forecasting Matters More in 2026
The cost of a wrong forecast is higher than it used to be.
Credit is tighter. Banks and lenders scrutinize 13-week forecasts before extending or renewing credit. Covenant conversations are driven by forecast quality, not by historical performance alone. A CFO who shows up with a stale monthly forecast loses negotiating position before the meeting starts.
The market punishes surprises. PE sponsors and boards measure teams on forecast accuracy, not just on performance against plan. A CFO who misses the quarterly cash forecast twice is a CFO who gets replaced.
The fundraising cycle doubled. Series A and B rounds that took four months in 2021 now take six to nine months. The forecast is the instrument that tells you when to start. CB Insights found that 70% of VC-backed startups that shut down since 2023 ran out of capital. Every one of those shutdowns had a forecast that lied.
Direct vs Indirect Cash Flow Forecasting
Most finance teams run the wrong method for the wrong horizon. That is the first structural mistake, and it compounds every week after. The direct method forecasts cash flow from actual expected receipts and payments. The indirect method forecasts cash flow by adjusting net income for non-cash items and working-capital changes.
| Attribute | Direct Method | Indirect Method |
|---|---|---|
| Source data | Bank transactions, AR aging, AP schedule, payroll runs | Income statement, balance sheet changes, non-cash adjustments |
| Best horizon | Short-term (13 weeks) | Medium to long-term (12+ months) |
| Accuracy at 4-week window | High (if data is live) | Medium |
| Who uses it | Treasury, FP&A, liquidity managers | Strategic finance, board reporting, long-range planning |
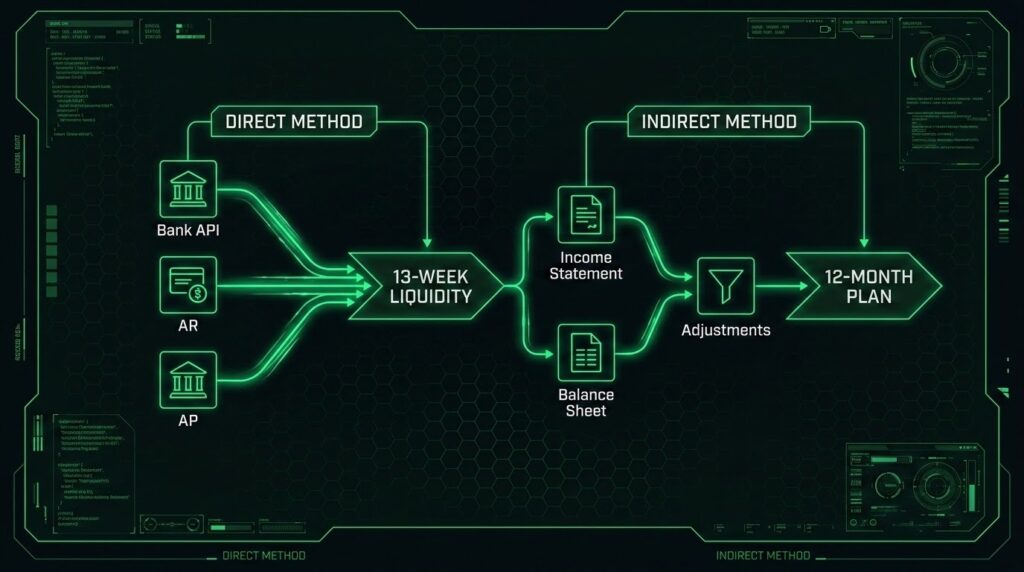
Use the direct method when the decision horizon is 13 weeks or shorter and the business has access to live bank and receivables data. Use the indirect method for 12-month and multi-year forecasts where accrual-based trends carry more signal than daily cash movements.
Most operations-heavy businesses between 50 and 500 employees run a hybrid. The direct method covers the 13-week rolling forecast. The indirect method rolls forward into a 12-month view. The two reconcile monthly. If they diverge by more than 5%, the inputs need an audit, not the model.
Cash Flow Forecasting Methods and Horizons
Every cash flow forecasting model serves a specific decision horizon. Mismatching the model to the horizon produces a number that is structurally incapable of answering the question being asked.
Short-term (13-week rolling). Direct method. Daily or weekly cadence. Driven by AR aging, AP schedule, payroll, and scheduled debt service. This is the liquidity instrument. It answers: “Do we have enough cash to meet obligations for the next quarter?”
Medium-term (12-month rolling). Hybrid approach. Monthly cadence. Driven by sales pipeline, budget, and seasonality. This is the planning instrument. It answers: “When do we need to raise, borrow, or cut?”
Long-term (3 to 5 years). Indirect method. Quarterly cadence. Driven by strategic plan, capex schedule, and capital structure assumptions. This is the fundraising and M&A instrument.
The three horizons feed each other. The 13-week forecast feeds the quarterly board deck. The 12-month forecast feeds the annual plan. The 5-year forecast feeds the fundraise and the acquisition conversation. A forecast is only as useful as the horizon of the decision it drives.

The 13-Week Rolling Forecast, Built for 2026
A 13-week rolling cash flow forecast is the operator’s baseline instrument. Here is how to build one that does not drift.
Step 1: List Every Cash Inflow Source
Start with customer receipts, broken out by customer if revenue is lumpy or concentrated. Add interest income, tax refunds, grants, and any financing inflows. The goal is a complete receipts register, not a summary line. A single “other income” bucket hides the variance that kills forecast accuracy at week 8.
Step 2: List Every Cash Outflow by Category
Payroll. Rent. Vendor payables. Tax payments. Debt service. Capex. One-time events like a legal settlement or an acquisition earn-out. Each category gets its own row. When an expense is buried inside another category, the forecast inherits a timing error that compounds weekly.
Step 3: Map the Timing
This step separates a useful forecast from a decorative one. Map each inflow and outflow to the week the cash actually clears the bank, not the week the invoice arrives. DSO and DPO are the timing discipline. A business with 45-day payment terms and an actual DSO of 62 days is forecasting from fiction if it uses the contractual date.
Step 4: Load the Starting Cash Balance
Pull the starting cash balance from the bank, not from the spreadsheet. If the bank balance and the spreadsheet disagree on day one, every subsequent week carries the error forward.
Step 5: Project Week by Week for 13 Weeks
Weekly buckets, not monthly averages. Monthly averages hide the weeks where cash dips below the minimum operating balance. A business that looks safe on a monthly view can be insolvent for 11 days inside that same month.
Step 6: Recalculate Weekly
Roll the first week off. Add a new week 13. Recalibrate every line with actuals from the week that just closed. The forecast is a living instrument. If it is recalculated monthly, it is a report, not a forecast.
Worked Cash Flow Forecasting Example
Apex Ventures is a 50-person Series A SaaS company with $1.8M in the bank and a 45-day DSO. Here is the full 13-week rolling forecast.
The Setup
| Parameter | Value |
|---|---|
| Starting cash balance | $1,800,000 |
| Biweekly payroll | $65,000 (Weeks 1, 3, 5, 7, 9, 11, 13) |
| Monthly rent | $18,000 (Weeks 1, 5, 9, 13) |
| Quarterly tax payment | $42,000 (Week 12) |
| Weekly debt service | $9,000 |
| Average DSO | 45 days (collections vary by customer cycle) |
The 13-Week Forecast
All figures in thousands. Positive net cash flow weeks are highlighted.
| Week | Recv | Payroll | Rent | Vendor | Tax | Debt | Total Out | Net | Ending Bal |
|---|---|---|---|---|---|---|---|---|---|
| 1 | $28 | $65 | $18 | $42 | — | $9 | $134 | -$106 | $1,694 |
| 2 | $32 | — | — | $28 | — | $9 | $37 | -$5 | $1,689 |
| 3 | $38 | $65 | — | $38 | — | $9 | $112 | -$74 | $1,615 |
| 4 | $72 | — | — | $45 | — | $9 | $54 | +$18 | $1,633 |
| 5 | $38 | $65 | $18 | $38 | — | $9 | $130 | -$92 | $1,541 |
| 6 | $42 | — | — | $42 | — | $9 | $51 | -$9 | $1,532 |
| 7 | $42 | $65 | — | $48 | — | $9 | $122 | -$80 | $1,452 |
| 8 | $68 | — | — | $35 | — | $9 | $44 | +$24 | $1,476 |
| 9 | $35 | $65 | $18 | $45 | — | $9 | $137 | -$102 | $1,374 |
| 10 | $58 | — | — | $52 | — | $9 | $61 | -$3 | $1,371 |
| 11 | $38 | $65 | — | $42 | — | $9 | $116 | -$78 | $1,293 |
| 12 | $32 | — | — | $55 | $42 | $9 | $106 | -$74 | $1,219 |
| 13 | $48 | $65 | $18 | $58 | — | $9 | $150 | -$102 | $1,117 |
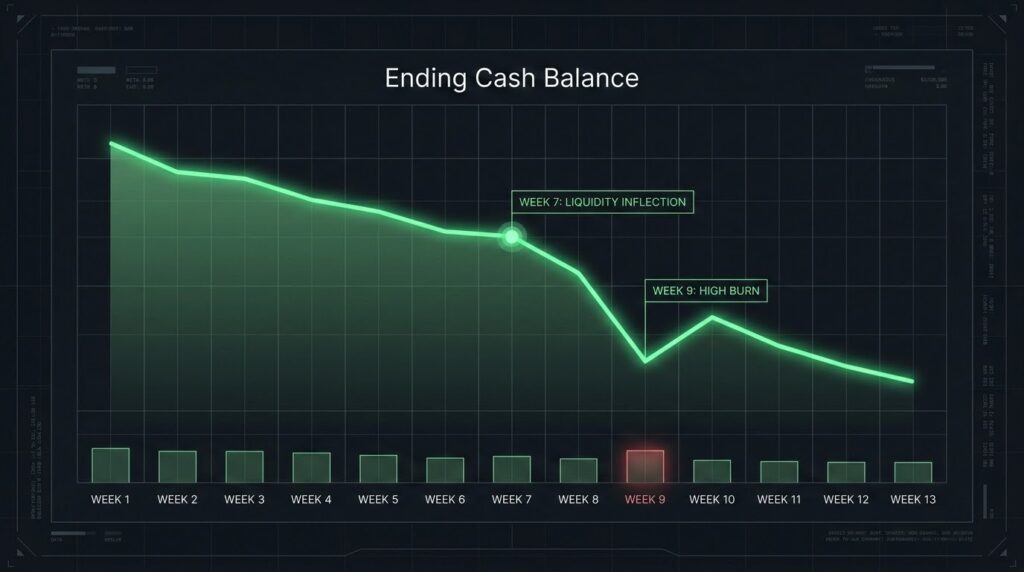
The Key Signals a CFO Reads From This
- Week 7 is the first liquidity inflection. Cash drops below $1.5M for the first time. Flag it for the board. This is the week to either accelerate collections or delay a discretionary payment.
- Week 9 is the biggest mid-horizon burn week. $102K out. The overlap of biweekly payroll, monthly rent, and a heavy vendor load lands on the same week. Week 1 is structurally heavier ($106K) because every category fires at once in the opening week. Week 9 is the one to watch because it repeats inside the cycle.
- Week 12 is the quarterly tax hit. $42K goes out on top of normal operating burn. A forecast that buries this inside “vendor” hides the decision point. The discipline is in the category, not the total.
- Net 13-week change: -$683K. Starting balance $1,800K minus $683K ending balance gives ~$1,117K. Average weekly burn: $53K. Monthly burn: ~$229K. Runway beyond Week 13 at this pace: ~4.9 months.
- Positive-flow weeks reflect collection cycles, not baseline operations. Weeks 4 and 8 look healthy only because enterprise invoices cleared. Strip those two weeks out and the baseline is brutal.
The discipline is not in the formula. The discipline is in the data that feeds it.
Cash Flow Forecasting Templates: Excel vs Modern Tools
Excel is still the most common cash flow forecasting tool. It is also the most common reason cash flow forecasts are wrong.
Why Excel stays dominant. Familiar. Cheap. Every finance team knows it. Owners can tweak any cell. For a stable, low-complexity business with a strong controller, a well-built cash flow forecasting template in Excel is genuinely enough.
Where Excel breaks. Manual data entry means stale inputs. No audit trail means no accountability. Version fragmentation across the finance team means different slides in different meetings. Scenario modeling is a copy-paste exercise that takes hours and introduces formula errors at every step.
What modern forecasting tools do differently. Pull transactions directly from bank APIs, accounting systems, and payroll systems. Track every input to its source. Run scenarios without rebuilding the sheet. The KPMG Global AI in Finance Report found that 71% of companies are already using AI in finance operations, and the gap between spreadsheet-based teams and tool-equipped teams widens every quarter.
The tool is not the answer. The data the tool pulls from is the answer.
Why Most Cash Flow Forecasts Are Wrong
Most cash flow forecasts are wrong because they inherit the lies of their inputs. The model is not the problem.
Stale AR and AP data. The aging report is 15 to 30 days behind. The cash timing the forecast depends on is built on yesterday’s reality. By the time the data reaches the spreadsheet, the operation has already moved.
Assumed collection dates, not real DSO. The forecast assumes customers pay on terms. The actual DSO is 17 days longer. Compound that across 13 weeks and the ending balance is wrong by hundreds of thousands of dollars.
One-off expenses buried as recurring. A legal settlement shows up as “vendor payment.” A severance package shows up as “payroll.” The baseline burn looks higher than it is, and the finance team spends two meetings debugging a phantom trend.
No scenario branching. The board asks “what if our top customer delays 60 days?” The spreadsheet takes two days to answer. The forecast becomes a static artifact, not a decision instrument.
No live recalibration. The forecast is recalculated monthly. By the time you see the variance, the quarter is over. Runway is the downstream output of the forecast. A forecast that lies produces a runway number that lies. See the companion guide on cash runway for the downstream treatment.
A cash flow forecast is only as honest as the data feeding it. The only fix is live data, grounded in the operation.
AI Cash Flow Forecasting: What It Actually Changes
AI cash flow forecasting is useful when the underlying data is live and integrated. When the data is stale, AI makes the forecast wrong faster.
What AI Genuinely Helps With
Pattern detection in collection behavior by customer. Seasonality calibration from historical cash flow data. Anomaly detection: why is this week’s payroll $14K higher than the rolling average? Scenario generation at speed, giving the CFO three branching outcomes before the board call instead of one static number.
What AI Does Not Change
AI cannot fix stale inputs. AI cannot categorize a transaction the accounting system has not captured yet. AI cannot predict a lost contract it has no signal about. The legacy FP&A stack’s core problem is data freshness, not model sophistication.
The Precondition for AI Forecasting to Work
Live, clean, integrated operating data. Every bank transaction, invoice, expense, and contract mapped to a common data structure. Without that foundation, AI forecasting is guessing faster. IBM research confirms the stakes: financial institutions that modernized their digital core realized cost-to-income ratio improvements of more than 14% and total cost-of-operations savings averaging 20 to 30%. The gains came from the data integration, not from the AI model alone.
AI cash flow forecasting is not a magic accuracy upgrade. It is a speed upgrade, a pattern-detection upgrade, and a scenario-modeling upgrade. But only when the data layer underneath is real.
How Truzer.ai Approaches Cash Flow Forecasting
Truzer.ai is built on a different premise than the legacy FP&A and treasury stack. The ontology creates itself.
The category problem. Most cash flow forecasting tools run on data that is 15 to 30 days stale. The AI layer on top guesses because the data underneath has no live connection to the operation.
Truzer’s approach. Truzer is built as a live digital twin of the business, which Truzer calls the ontology. Point Truzer at a bank, accounting, payroll, and ERP source, and the ontology builds itself in under 60 seconds. Every transaction, invoice, expense, contract, and payroll run maps to the ontology in real time. The forecast recalculates the moment a transaction clears. Scenario modeling runs live against the ontology, not against a stale snapshot.
Deployment. 48 hours from first connector to live control tower. Truzer connects to existing bank, accounting (QuickBooks, Xero), ERP (NetSuite, SAP, Oracle), payroll, and operational data sources including Foundry-native deployment paths. No rip-and-replace.
Security. AES-256 at rest, TLS 1.3 in transit, scoped tokens with role-based access control, isolated AI inference environments, zero external API calls. The AI is grounded in the ontology, not in generic training data.
Proactive alerts, not passive dashboards. Truzer sends an SMS or email the moment the ontology detects a runway drop below threshold, a DSO spike, or an unexpected vendor payment. The CFO gets told. Nobody has to log in to find out.
Truzer is a new entrant. This guide does not pretend otherwise. The thesis is simple: a cash flow forecast grounded in a live ontology is structurally more honest than one rebuilt from last month’s export.
See the cash flow ontology build itself live, or explore the single control tower for the whole operation.